Blueprint Test Prep
Branding / Visual Design / Landing Pages / Ad Optimization
Interactive event focused on Shiba Inus and their owners
OVERVIEW
- Full ownership of visual identity
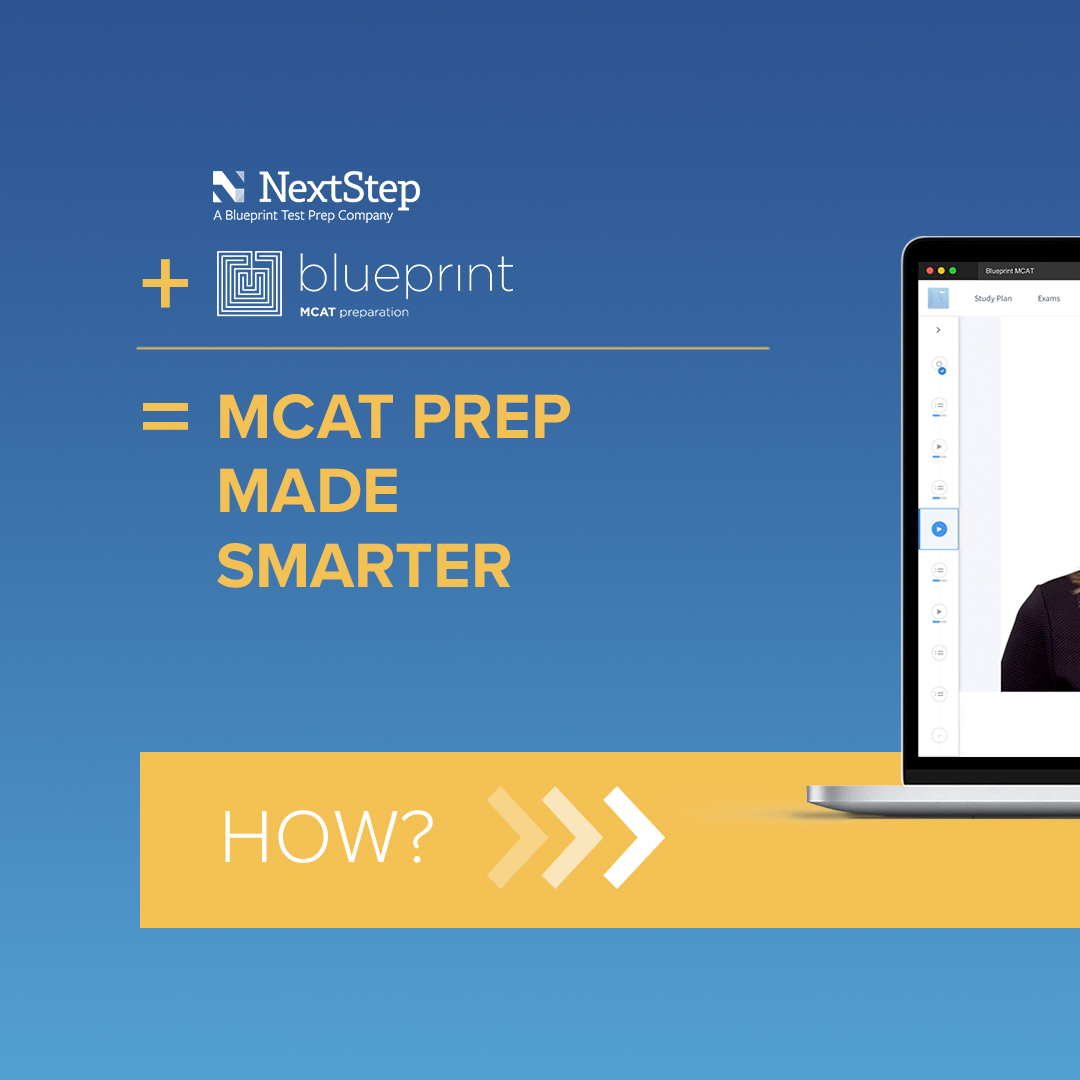
- Integrated 4+ acquired brands into existing brand image and voice
- Worked closely with ad buyers to test and optimize paid google and social ads
+320%
Avg increase in ad conversion rate
-60%
Avg decrease in CPA
+200%
Avg increase in landing page conversion
+100%
Avg increase in email CTR

Adding motion graphics to adsets led to an enormous spike in conversion.
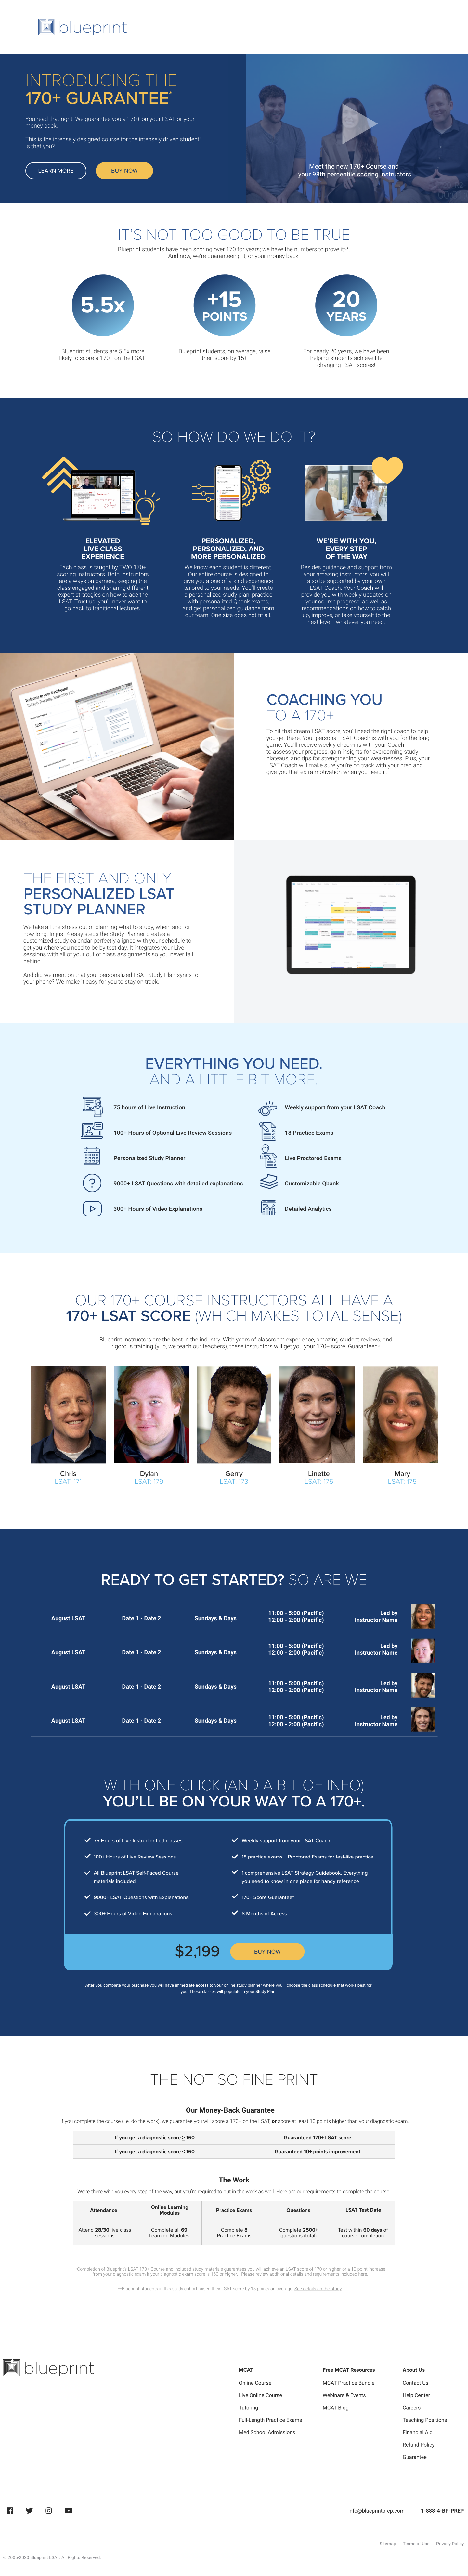
Data-driven design
Analytics & Heatmaps
- Users visited multiple times before buying; typically on a third or fourth touch they will go straight to the buy button.
- While heatmaps and time-on-page stats show that very few users scroll to the bottom of the page, experiments with shortening the page reduced conversion rates.
- The heatmap also indicated that users interacted heavily with expandable content sections, showing that users were invested in consuming content on a detailed level.
- The two above points suggested (and focus groups later confirmed) that the presence of content increased users' confidence in the product, even if they didn't necessarily engage with it all
Focus Groups
Focus groups were composed of both students who had already purchased some version of the product and groups in our target demographics who were assembled by a third party.They were observed navigating the site and asked about what might improve their chance to buy and their overal limpression of the company. Users' key desires included:
- More images of the actual product, as opposed to students/testimonials
- See more instructors
- Clarify exactly what is included in each package